Caju Growth Design
Overview
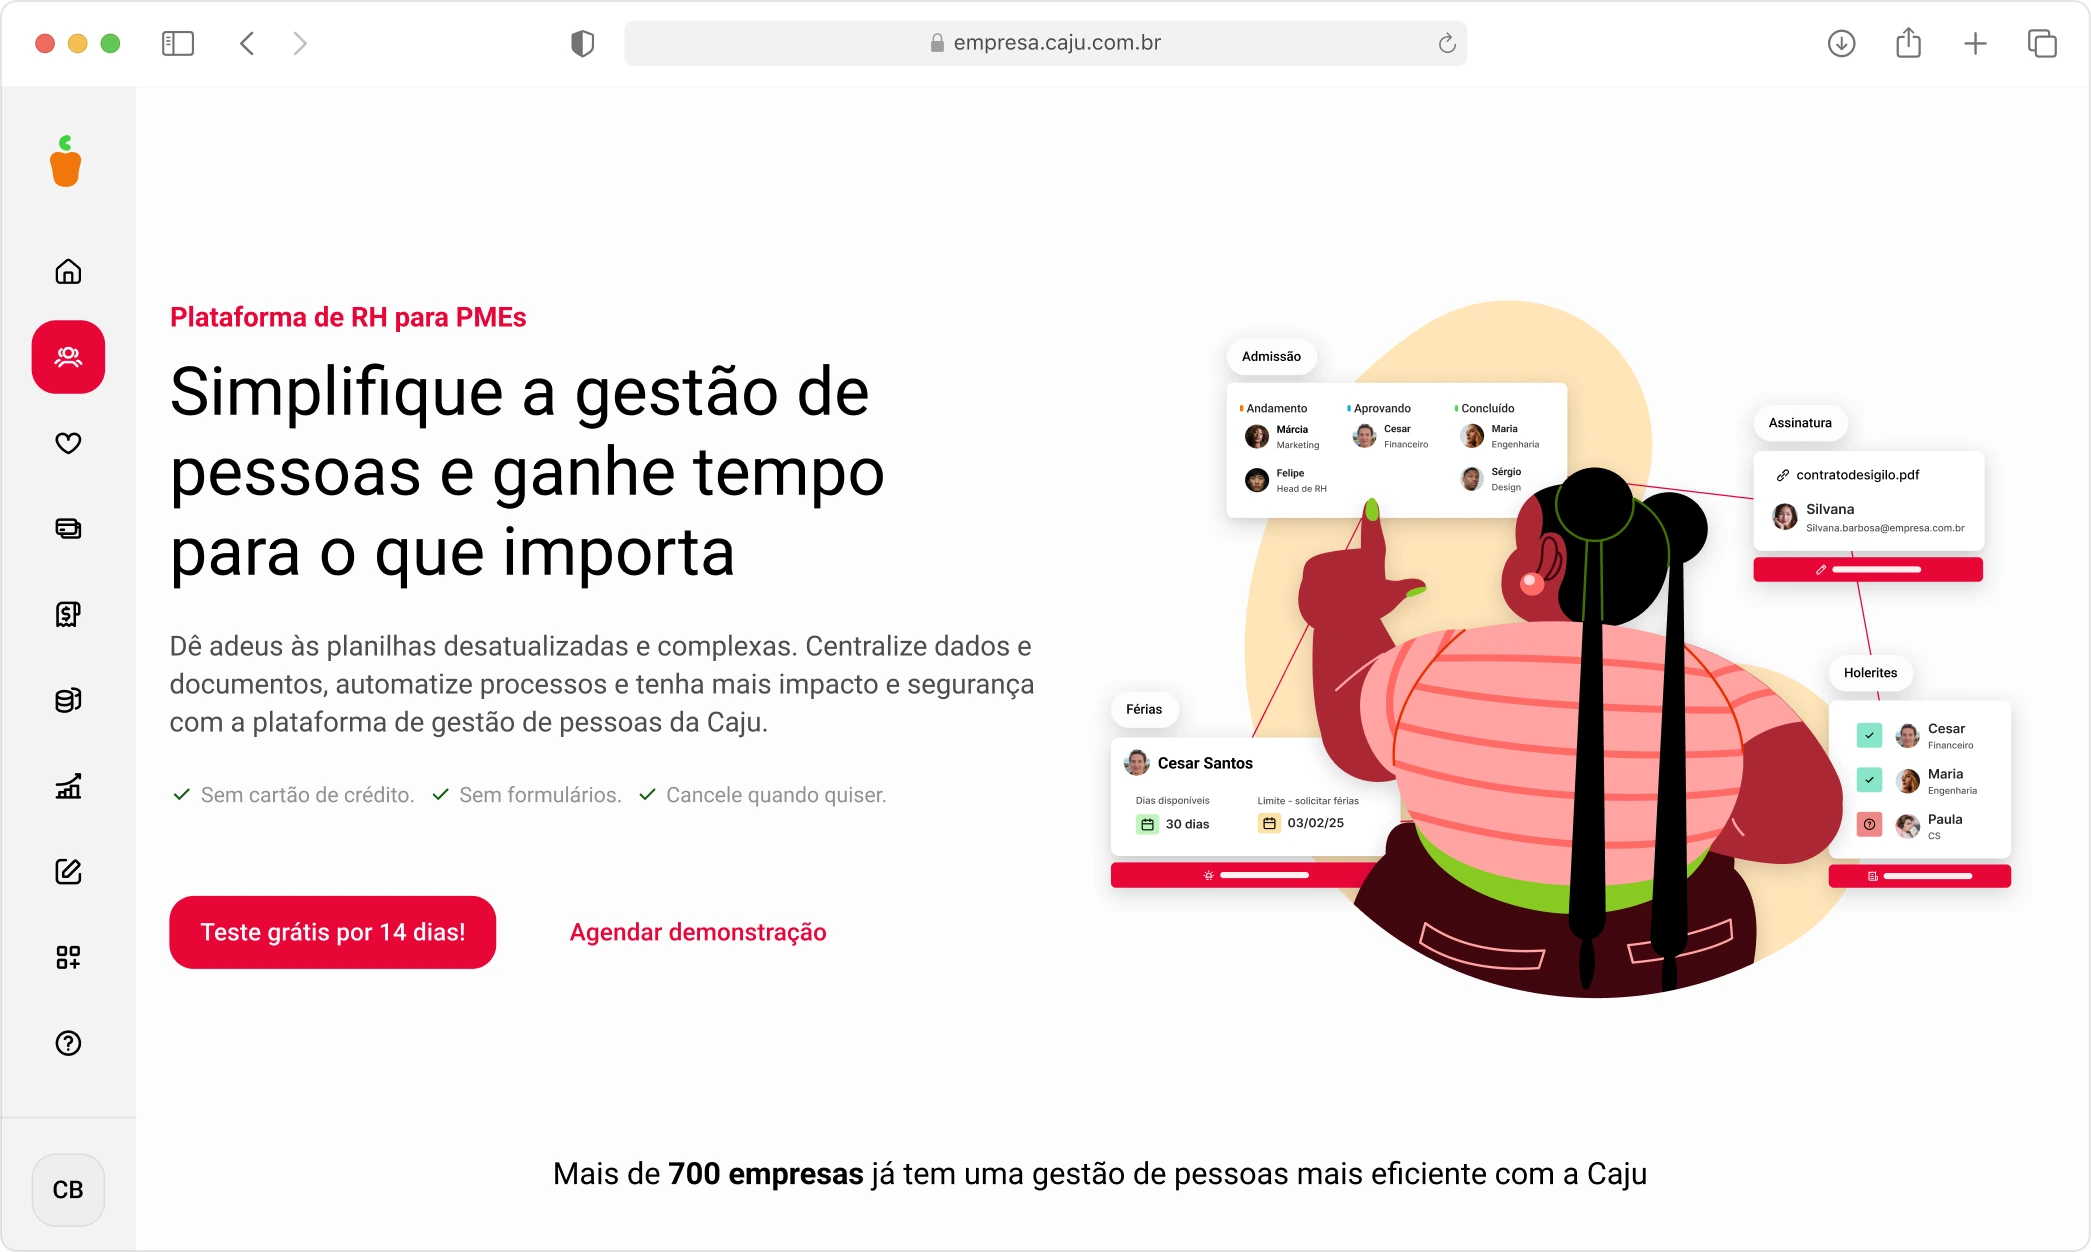
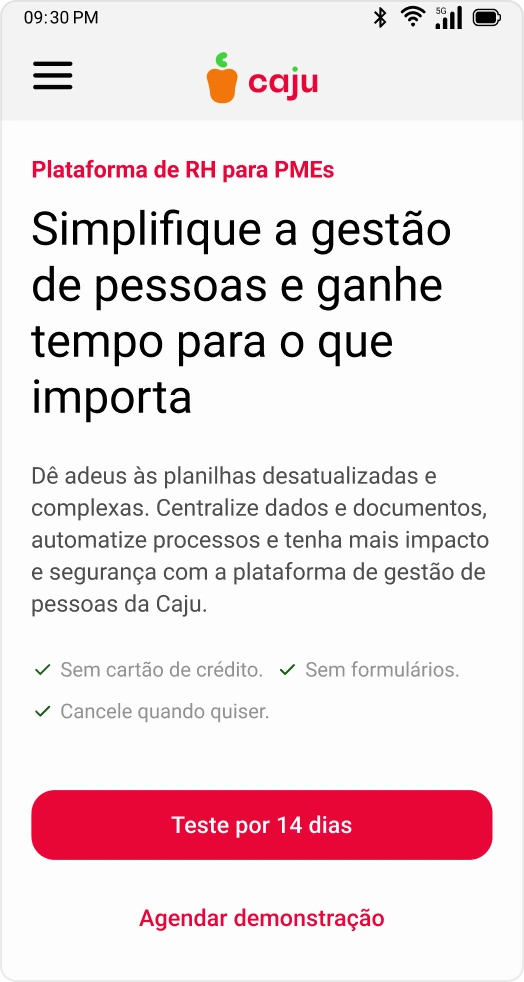
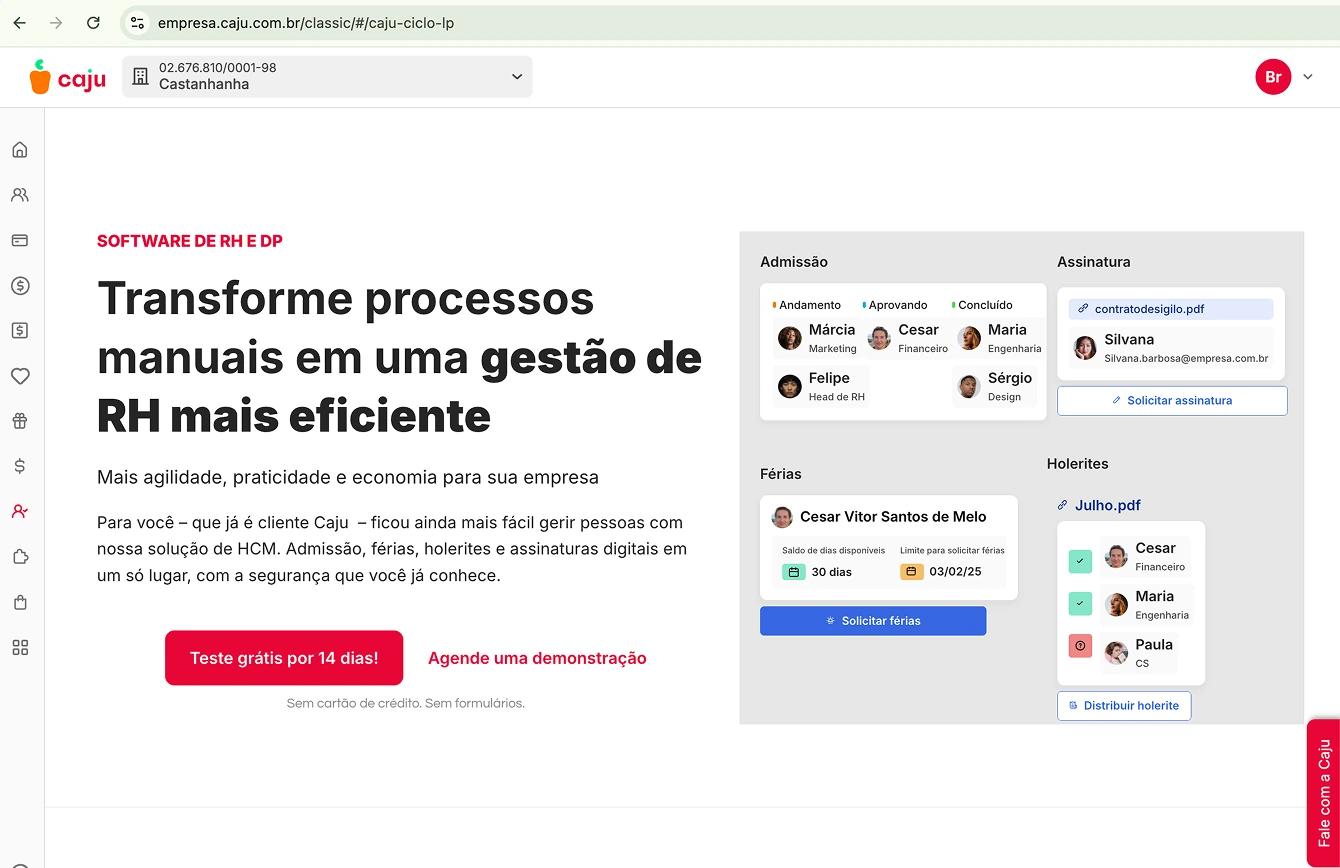
Caju’s Human Capital Management (HCM) module was facing a growth plateau in the middle of the funnel (MoFu), with an average lead-to-hire rate (LP2HR) of just 3.3%. The previous experience featured a generic, poorly contextualized landing page with only three conversion points that did not cater to the different levels of maturity and customer profiles.
Details
Role: Product Designer
Focus: Discovery, CRO, UI/UX, and page development in Framer.
 Before
Outcome
The initiative built a more efficient and scalable conversion engine for Caju’s HCM ecosystem.
Funnel scalability: 100% rollout integrated with multiple sidebar entry points and direct product access points.
Clarity of intent: Adoption of granular metrics (LP2FT, LP2Engagement) for data-driven decision-making with the product team.
Ideation
The new landing page was designed to combine a clear value proposition, reduced cognitive friction, and conversion paths tailored to each lead’s stage in the journey.
Modular section architecture: Structured into strategic blocks with a header focused on the primary business benefit, a feature showcase without excessive scrolling, a “Before vs. After” block, social proof, a plans/pricing table, and contextual FAQs.
Multichannel CTA matrix:
- Tech Touch (Primary): Direct access to the Free Trial with simplified terms acceptance.
- Mid/High Touch: Referral to a meeting with the sales team for strategic accounts.
- Interest: Interactive demo video to engage leads before they commit to a trial.
Data tracking: Individual event tagging for precise mapping of behavior by touchpoint and referral source.
Solution
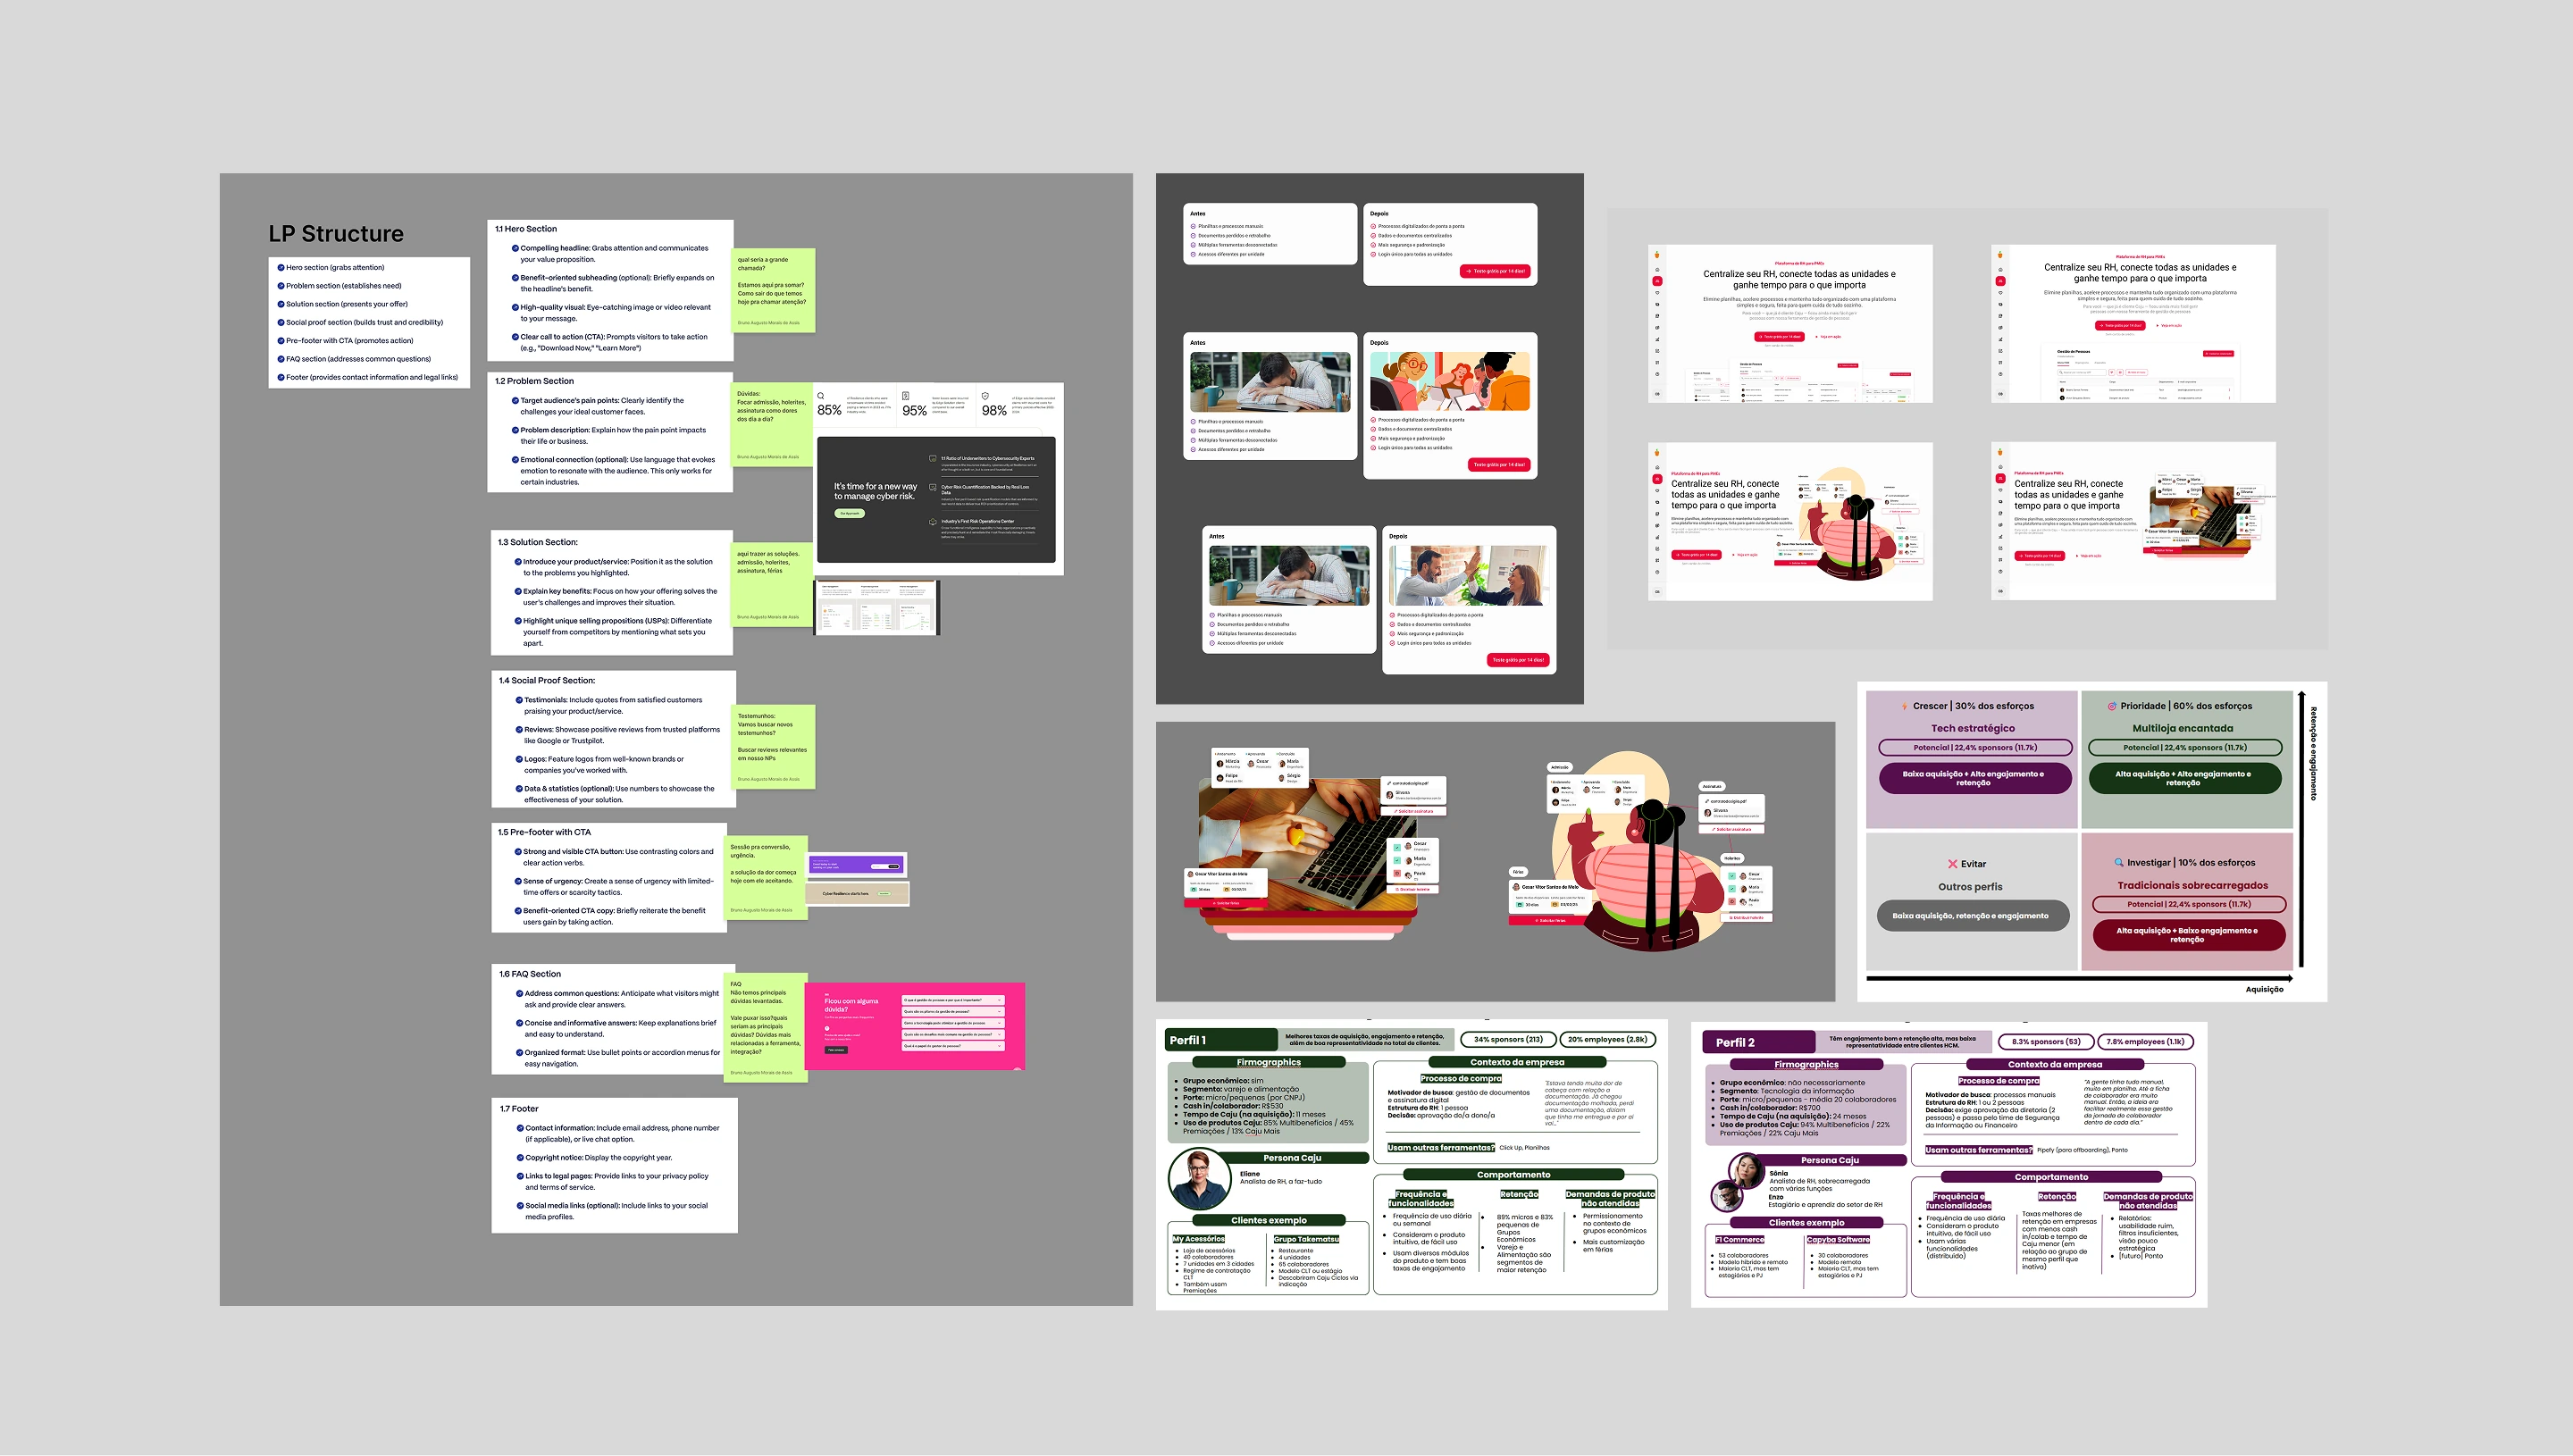
The exploration process combined visual references from modern B2B products with CRO best practices for B2B SaaS.
- Benchmarking and inspiration: Analysis of reference platforms focusing on layouts with interactive demos, clean hierarchy, and visual storytelling.
- Mapping Objections and Value Proposition: Identifying pain points for priority profiles (Strategic Tech and Enchanted Stores) to translate complex HR functionalities into tangible benefits.
- Prototyping and refinement in Figma: Creation of wireframes and modular layouts in Figma with a focus on consistency with the design system and implementation via Framer.
- Development in Framer: Building responsive and interactive features while ensuring visual fidelity and fast loading times within the app.
Impact
Validation was conducted via A/B testing against the legacy version, and after rollout to 100% of the user base, the new page achieved the highest conversion rate of the year.
Revenue Qualification: The combination of a significant increase in Free Trials (+80%) and direct sales (+260%) proved that reducing initial friction converts more paying customers than forcing early sales outreach.
Annual record: The page established itself as the primary channel for activation and conversion of new modules in the HCM vertical.
Reflection
The project consolidated insights into design practices guided by business metrics and technical autonomy.
Direct experimentation overcomes friction: Reducing barriers for users to test the tool on their own generated more net revenue than relying solely on sales conversations.
Autonomy with no-code: The designer’s creation of the page in Framer proved to be an agile model for validating growth hypotheses without overburdening the engineering pipeline.
Next steps: Develop dynamic A/B tests based on the industry segment and size of each logged-in company.